Strategic Sites
ICEYE gives valuable actionable data with timely delivery when it is needed.
It achieves real persistent monitoring of any location several times per day.
ICEYE SAR micro-satellites have the ability to obtain high resolution imagery during any weather conditions and darkness.
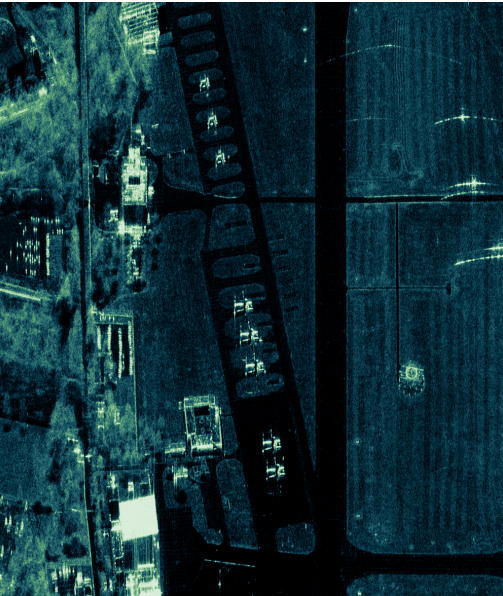
Source: 'ICEYE Application Study Site, 'Monitor Any Strategic Site, All The Time' (https://www.iceye.com/sar-data/use-cases/site-activity-monitoring#form)
ICEYE & Change Detection
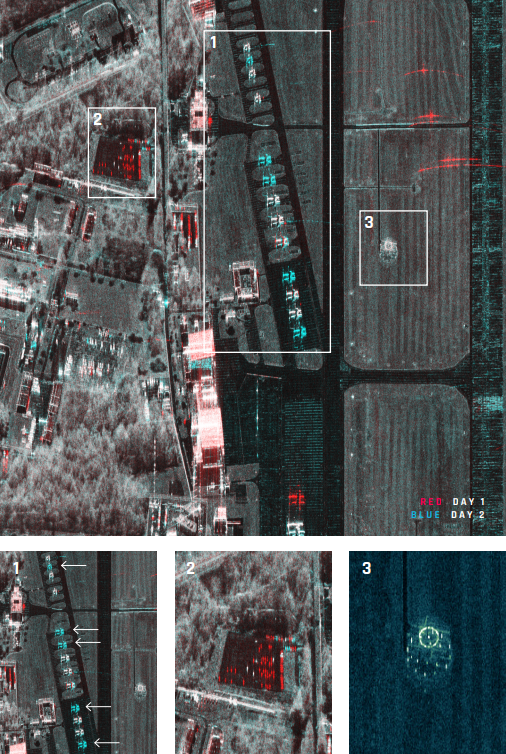
Below the Amplitude Change Detection (ACD) analysis is made up of two ICEYE SAR images of an airport taken 24 hours apart.
The red color depicts objects that were only present in the first image & not in the second.
The blue color indicates objects that were present in the second image.
The grey areas and objects remained stable and present on both imageries.
Source: 'ICEYE Application Study Site, 'Monitor Any Strategic Site, All The Time' (https://www.iceye.com/sar-data/use-cases/site-activity-monitoring#form)
1st Image: New Aircraft Detection
5 new aircrafts were detected on the apron of the airport compared to the data that was taken the day before. New aircrafts are depicted in blue.
2nd Image: Changes in the density of vehicles
A reduction in vehicles was detected in the area of interest. Vehicles that were present on the first day but were not there the second. These vehicles are represented with the color red.
3rd Image: High Resolution view of Airport INFRA
The last image depicts the airport's radio navigation infrastructure in high resolution. One can view clearly the details of the existing infrastructure & monitor for new constructions.